12-Week Challenge
How to fill out the Excel sheet
Overview
When you have received the link to this webpage, you should have also received an invitation to the shared Excel file. Try to open it. Sometimes Microsoft is temperamental and it doesn't work the first time. If you have any issues accessing it, please let me know as soon as possible (e.g., by pressing the button below).
1. How to find your sheet
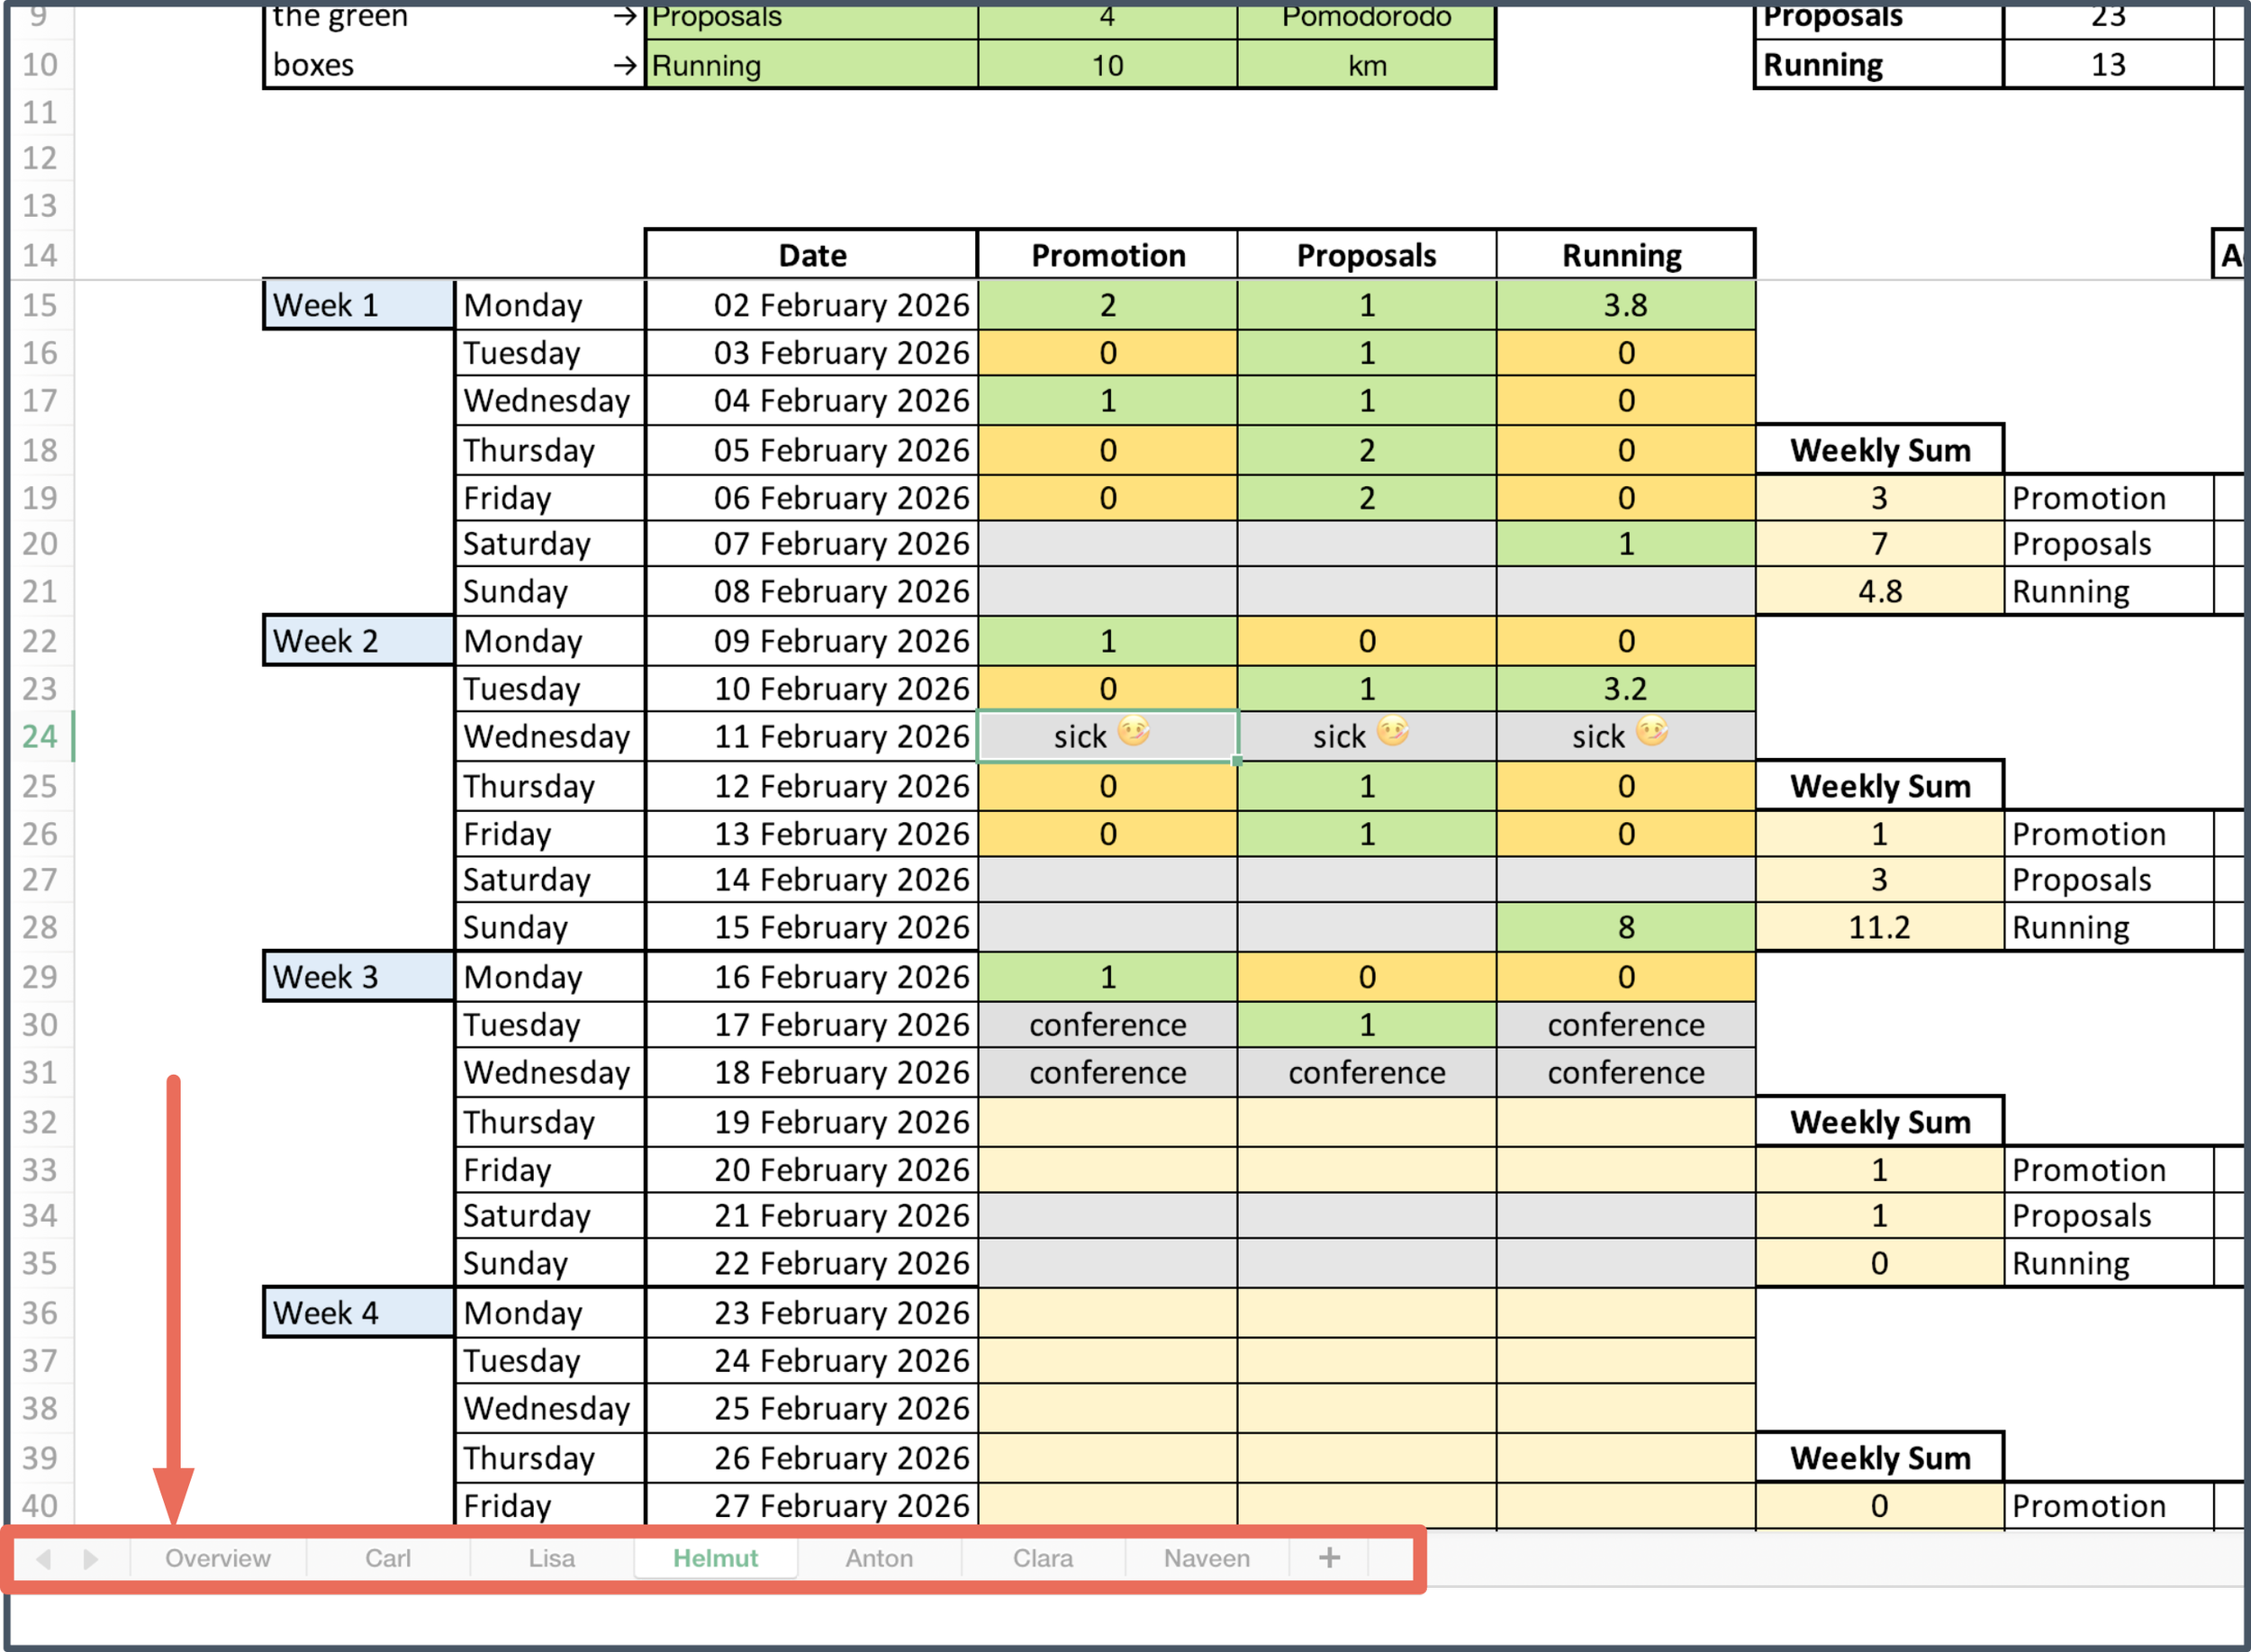
Everyone has their own sheet in the Excel file. Have a look at the bottom and find your name (see screenshot), and click on it.
2. Fill out your three goals
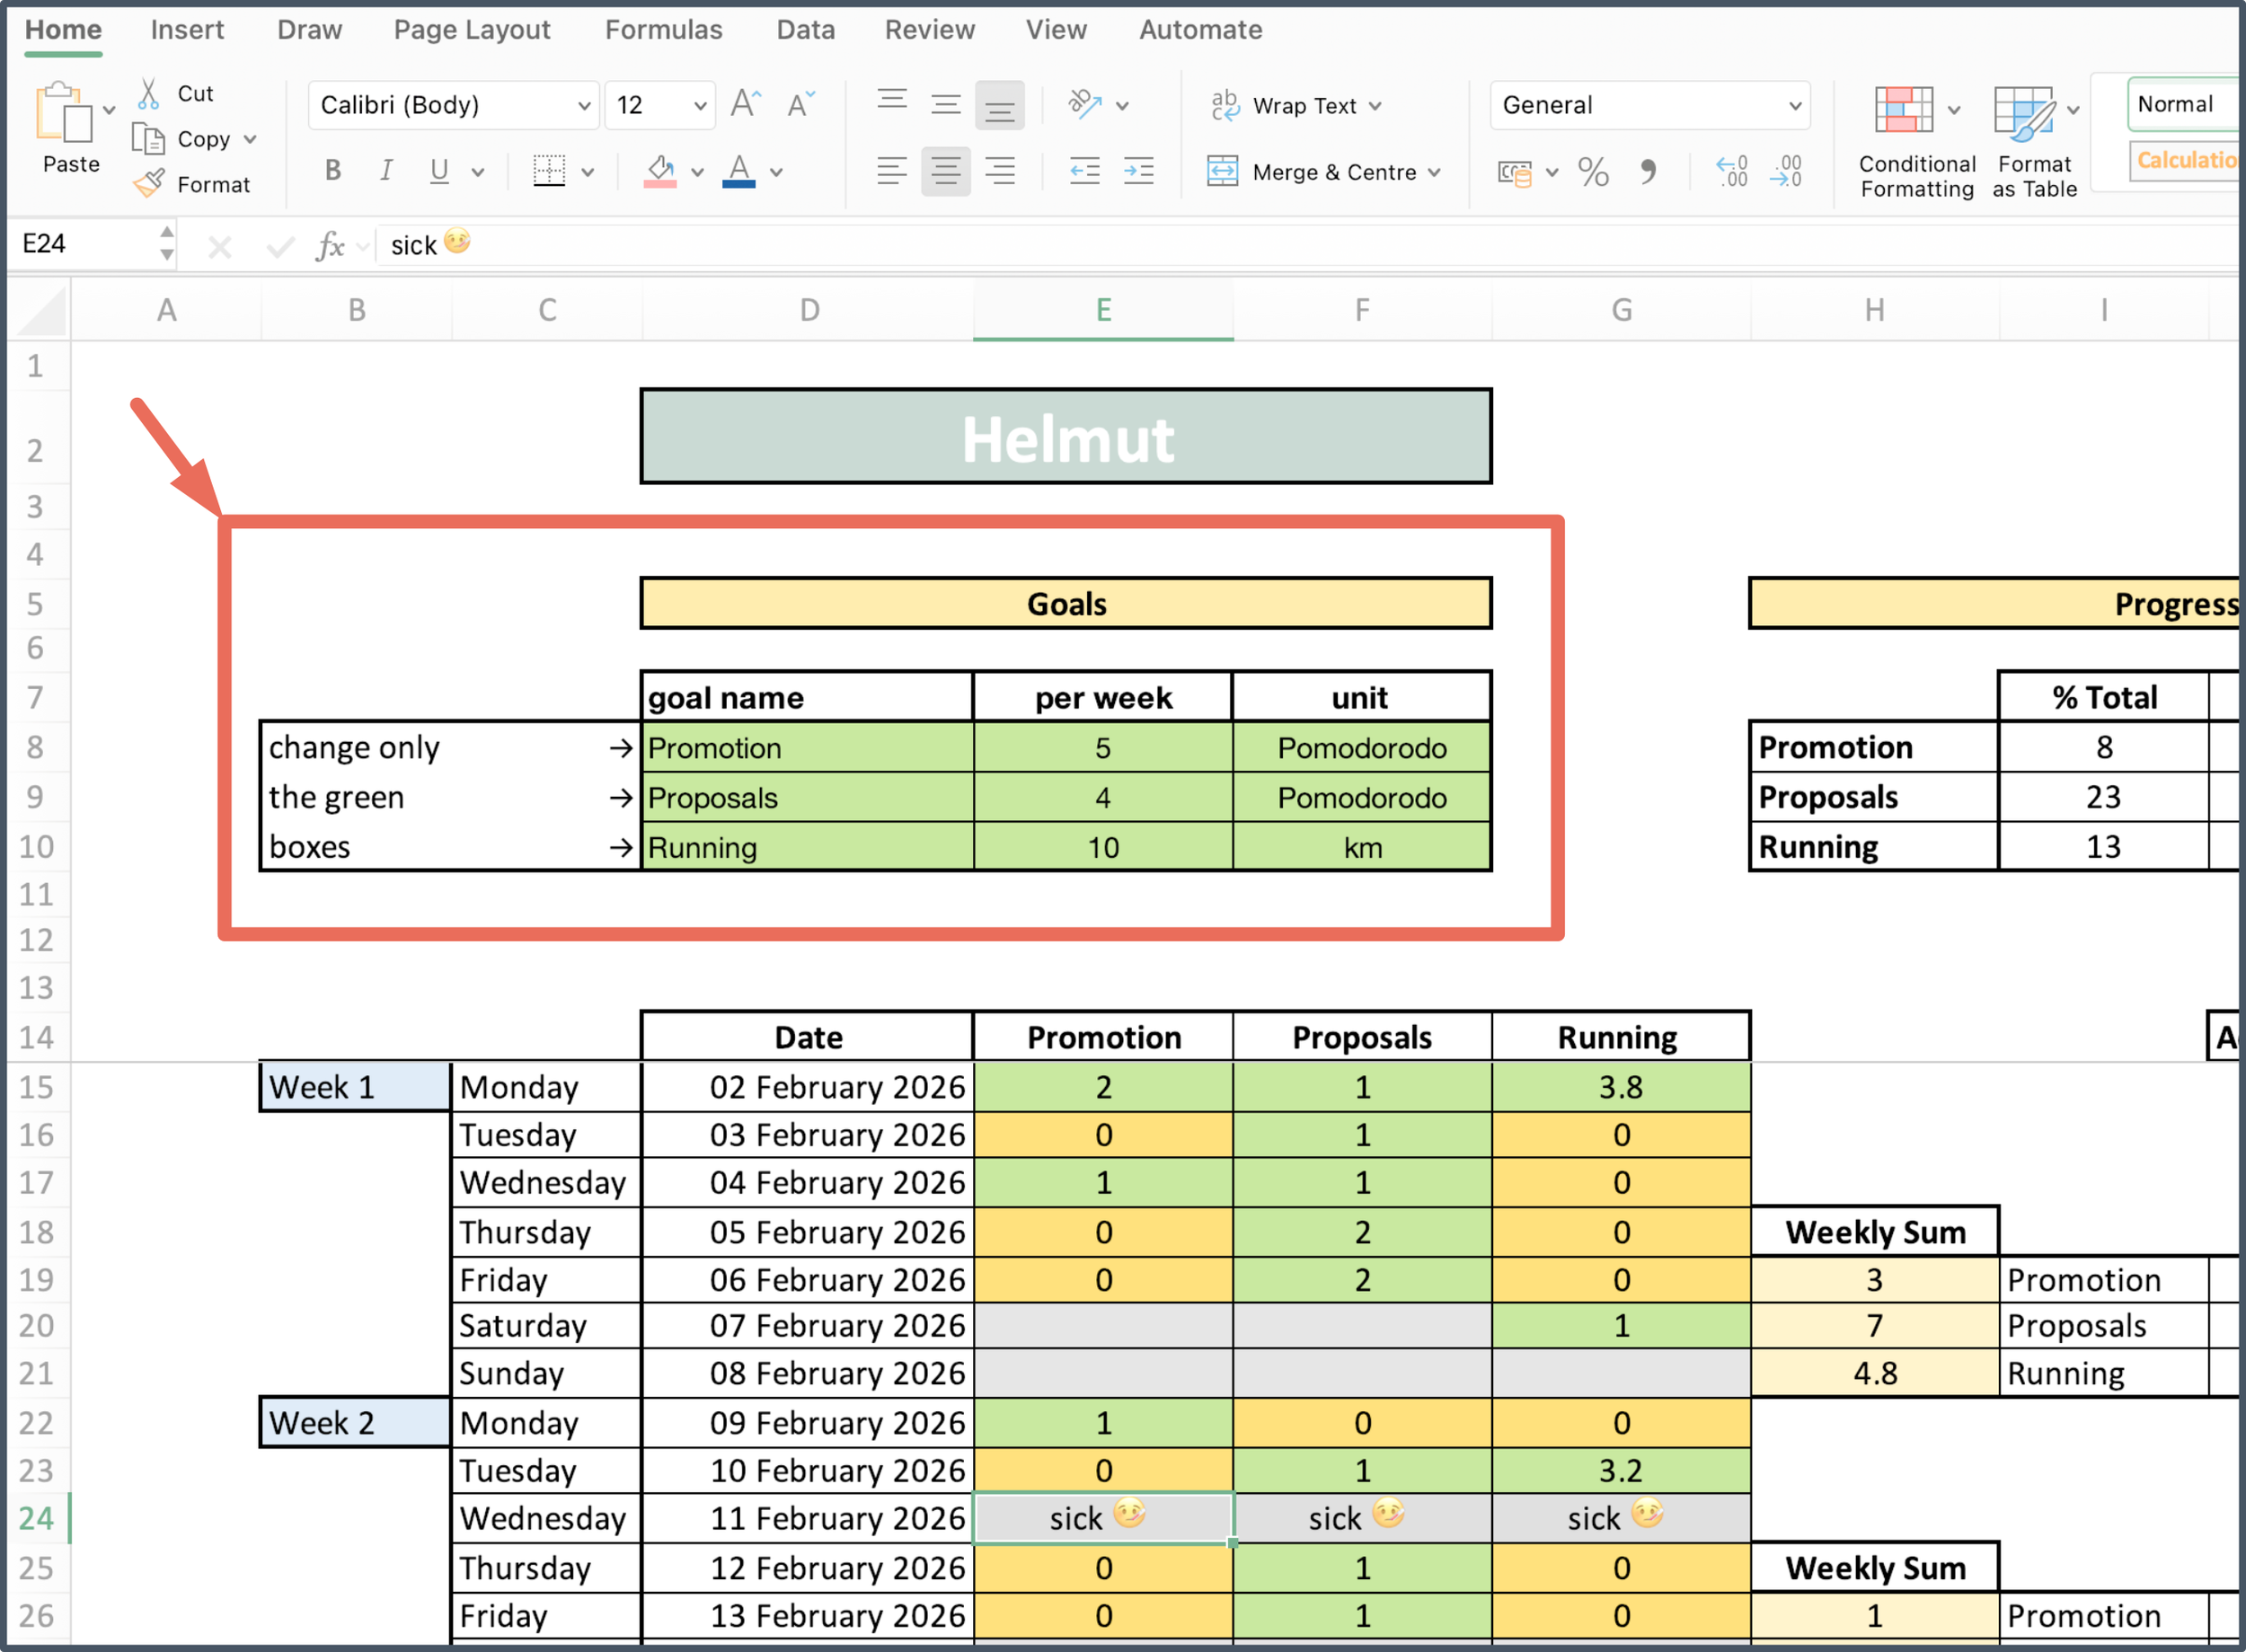
On top of your sheet you find a box with a green background (i.e., rows 8, 9 and 10 and columns D, E and F). Fill out for each goal the corresponding name, how much work you want to put into it each week (on average!) and the corresponding unit on how you measure your progress (e.g., pomodoros, kms, hours, times, etc.). If you are unsure how to do it, have another look at “12-Week Overview”.
3. Log your progress
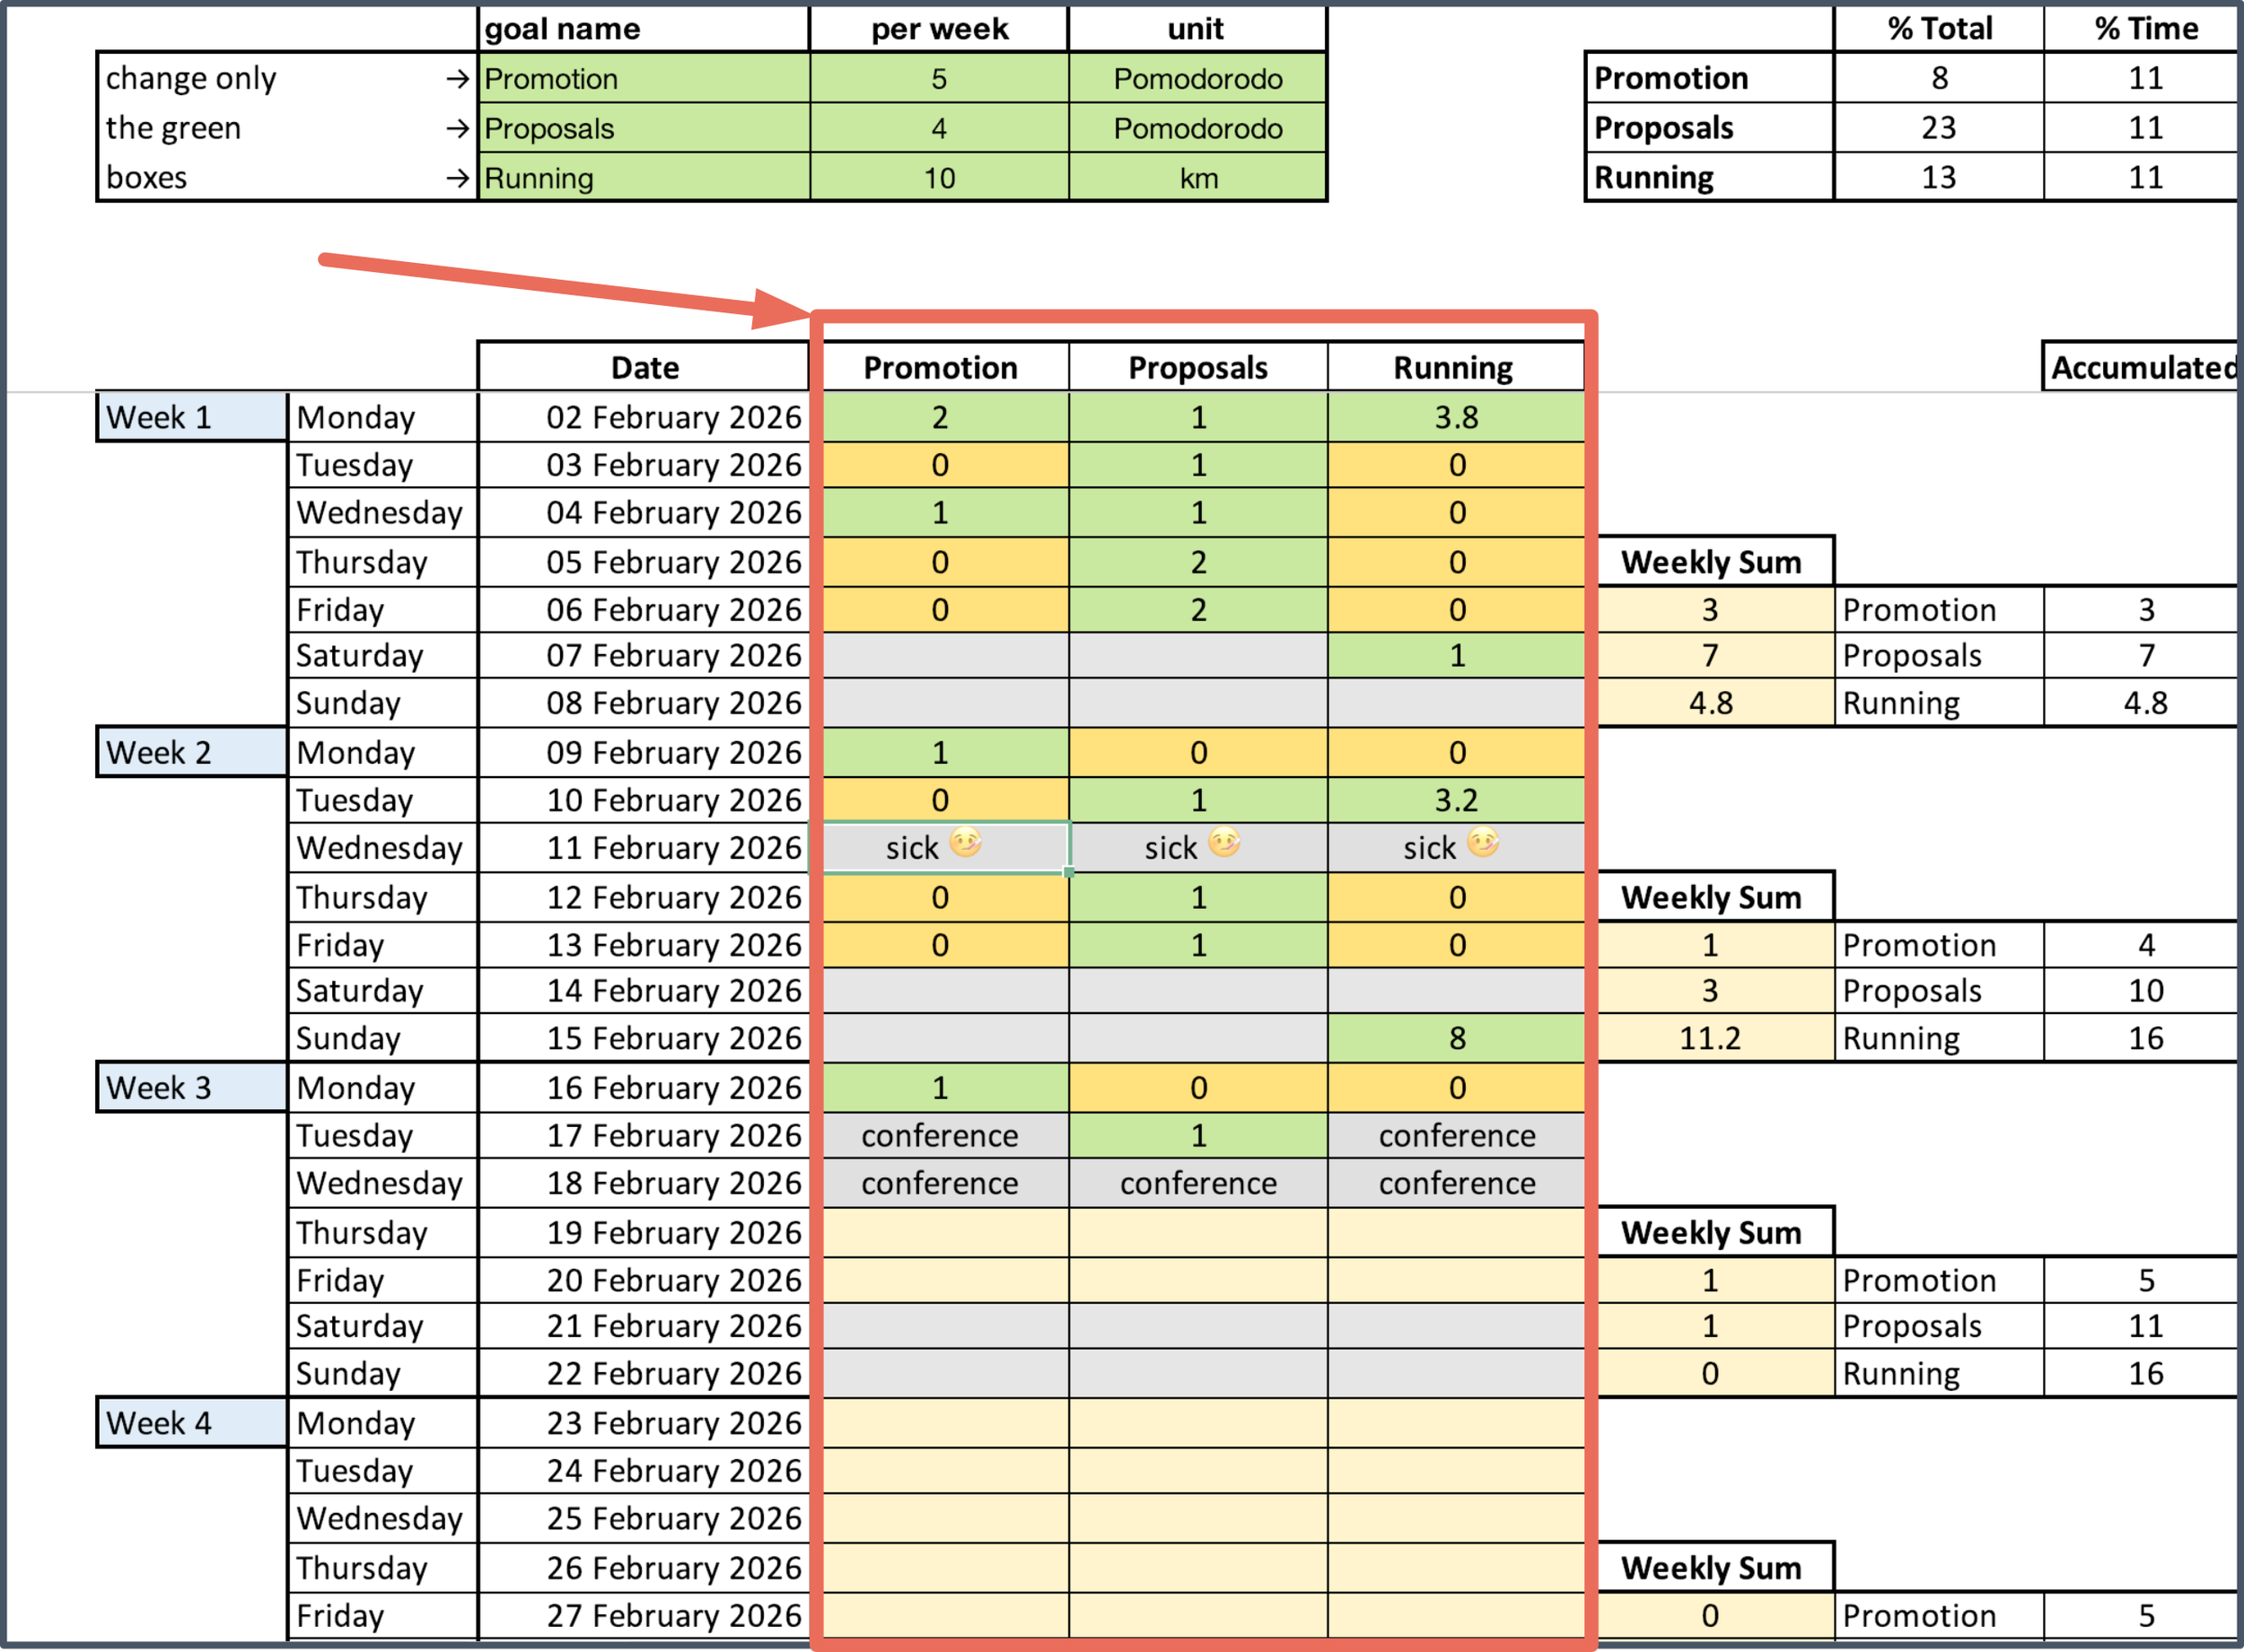
Every day you should log your progress - see example in the picture. This is crucial as this keeps you engaged and it will help me to give you personalised feedback.
Make sure you fill out the right row (check the date). The top part of the sheet is frozen to keep the overview and your goals in focus. You may have to scroll to find the starting week.
🔒 Note that the Excel sheet is protected so that you can only change values in the fields that you are meant to. This means, you don’t have to be afraid to break anything.
If you have special circumstances, e.g., if you get sick, or if you are on vacation, or you are away on a conference, make a small comment in the field instead (see examples - Excel sheet will make the background grey). This will help me to understand your situation better and allows me to adapt my feedback to you. If I see only empty fields, I assume you fell of the bandwaggon and I will "annoy” you with reminders 😉.
4. Visual feedback
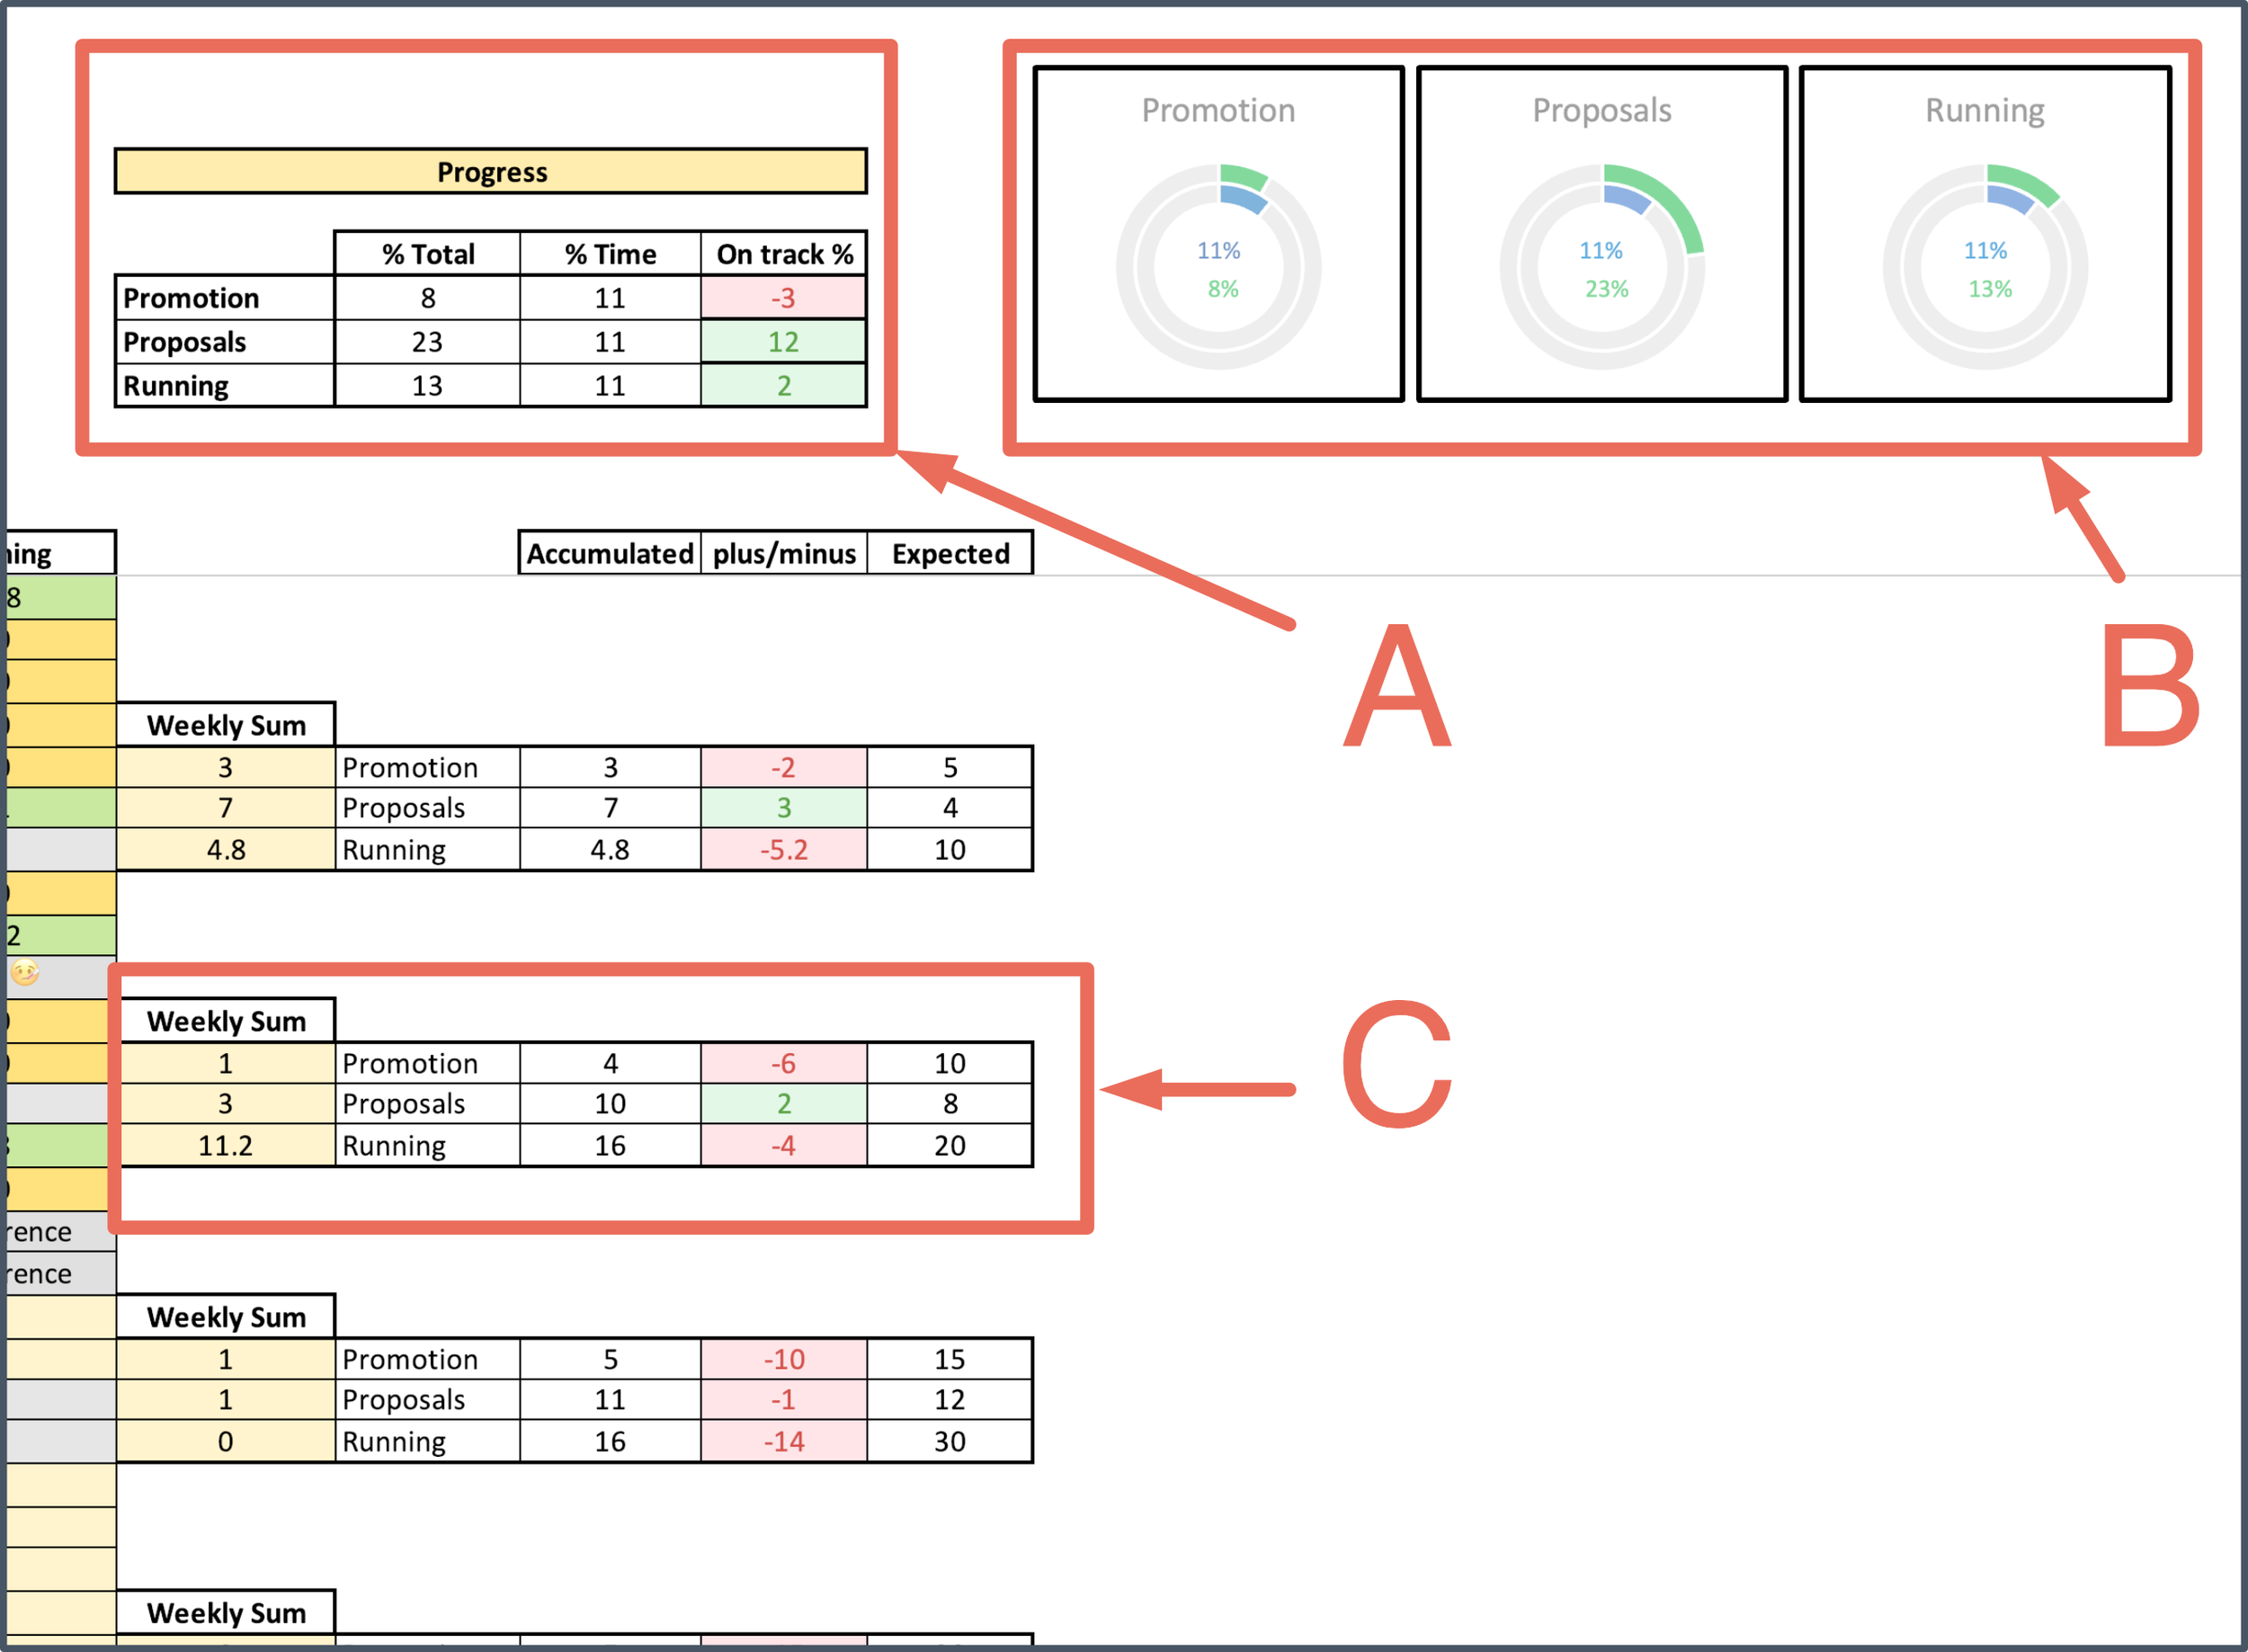
The Excel uses your goals (green box), your logged progress, and the current date to calculate data to give you feedback (see screenshot). This should give you some motivation, but please remember, you don’t have to stay ahead in every single goal every week as there will be ebbs and flows (e.g., deadline!) that are different for different goals. However, make sure not to loose one of the goals completely.
(A) Total Progress
This gives an overview of all your three goals and how much you have progressed so far (100% is what you will accumulate over 12 weeks) and compares it to what is expected on the current date (% Time). It gives you also some visual feedback if you are ahead (green) or behind (red) expressed as difference in percentage points.
In the example, 11% of the 12 weeks have passed and the participant is a little bit behind in the Promotion goal (8%), but far ahead in the Proposal goal (13%).
(B) Total Progress visually
This is the same data as in (A), but presented as progress rings. The inner blue ring is the progressed time, the outer ring the goal.
(C) Weekly summary and accumulated progress
For every week you can see the total sum achieved that week for each goal (yellow fields). In addition, each goals show the accumulated progress from all weeks up to this week (accumualted). It also calculated the expected accumulated effort (expected) and compares it to your accumulated progress (plus/minus). The colour shows if you are behind or in front.